
Imagine walking into a supermarket where the price of a gallon of milk changes every single second. One moment it is 3.50, the next it is 3.55, and then it drops to 3.48 based on how many people are reaching for the shelf. If you took a photo of that price tag at a specific moment, that image would be a Stock Quote.
At its core, a stock quote represents the price of a specific stock at a specific point in time as determined by the interaction of buyers and sellers. However, for a savvy investor, it is much more than just a price tag; it is a dashboard revealing the company’s current value, trading activity, and market sentiment.
This guide will walk you through a standard stock quote—using Apple Inc. (AAPL) as our example—reading it from top to bottom, just as you would on a financial website.
Key Takeaways
- A Stock Quote is a Snapshot: It shows the price and trading data for a specific moment in time.
- Price vs. Valuation: The "Last Price" tells you the cost to buy a share, while metrics like P/E Ratio tell you if that price is expensive relative to the company's earnings.
- Bid and Ask: You rarely pay the exact "market price"; you pay the "Ask" price, while sellers receive the "Bid" price.
- Volume: This indicates how active the stock is; high volume usually means it is easier to buy or sell without affecting the price.
The Identity Card: Ticker Symbols and Exchanges
When you look up a quote, the first thing you see is the company's name followed by a set of letters. This is the Ticker Symbol.
- Ticker: A unique series of letters assigned to a security for trading purposes. For Apple, the ticker is AAPL.
- Exchange: This tells you where the stock is bought and sold. Apple trades on the NASDAQ, while a company like the Coca-Cola Company (KO) trades on the NYSE (New York Stock Exchange).
Why it matters: Always double-check the ticker. Ford Motor Company is "F", but a completely different company, FORWARD Industries, uses "FORD". Mistaking the two could be a costly error.
The Headline Numbers: Last Price and Price Changes
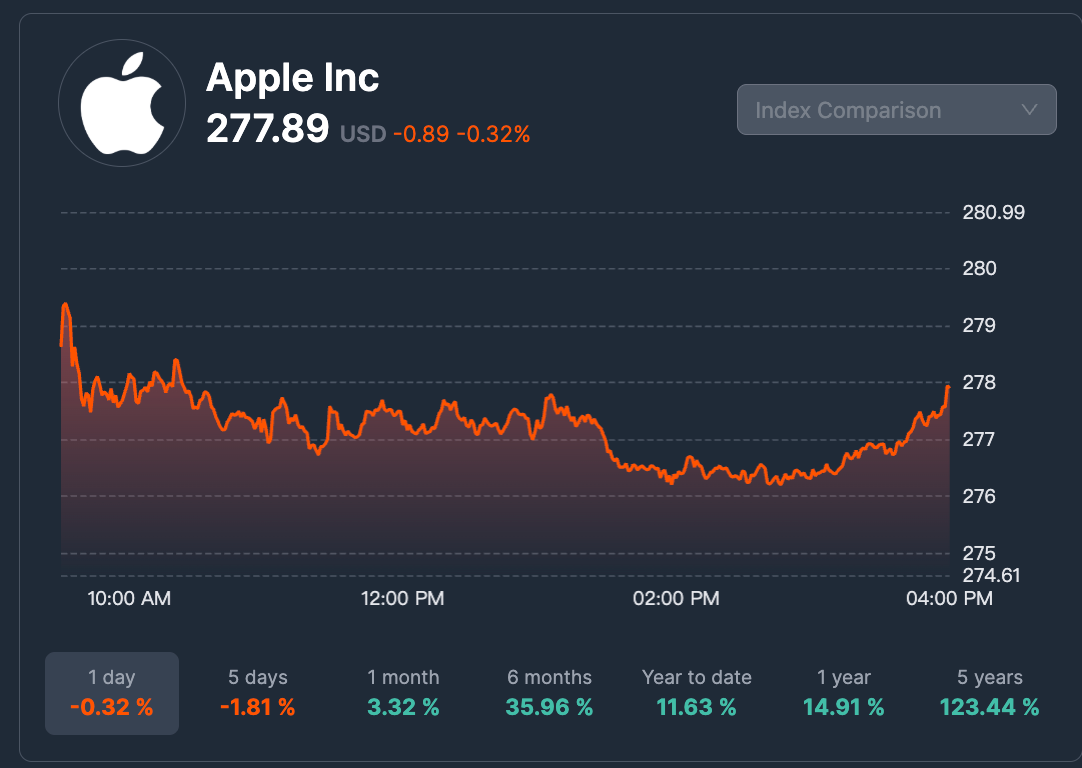 The most prominent number on the screen is the Last Price (or Last Traded Price). Based on the latest data, you might see AAPL at 277.89. This means the last transaction between a buyer and a seller happened at exactly that amount.
Next to the price, you will usually see a number in green or red. In our example, it shows -0.89 (-0.32%).
- Net Change: The dollar amount the stock has moved since the previous trading day ended. Here, the stock is down 0.89 dollars.
- Percentage Change: The mathematical percentage of that move. A 0.32% drop is relatively small, indicating a fairly stable trading day despite the negative direction.
Context: The color is a quick visual indicator. Red typically means the stock is trading lower than yesterday's close, while green means it is higher. If you check the trend over a longer period, such as 1 year, you might see a completely different story (e.g., +14.91%), which helps put a single day's drop into perspective.
If you are wondering why these numbers fluctuate so wildly during the day, you can read more about what makes the stock market go up and down.
The Auction Floor: Bid, Ask, and Spread
Here is a detail many beginners miss: The "Last Price" is history. It has already happened. If you want to buy shares right now, you need to look at the Bid and Ask.
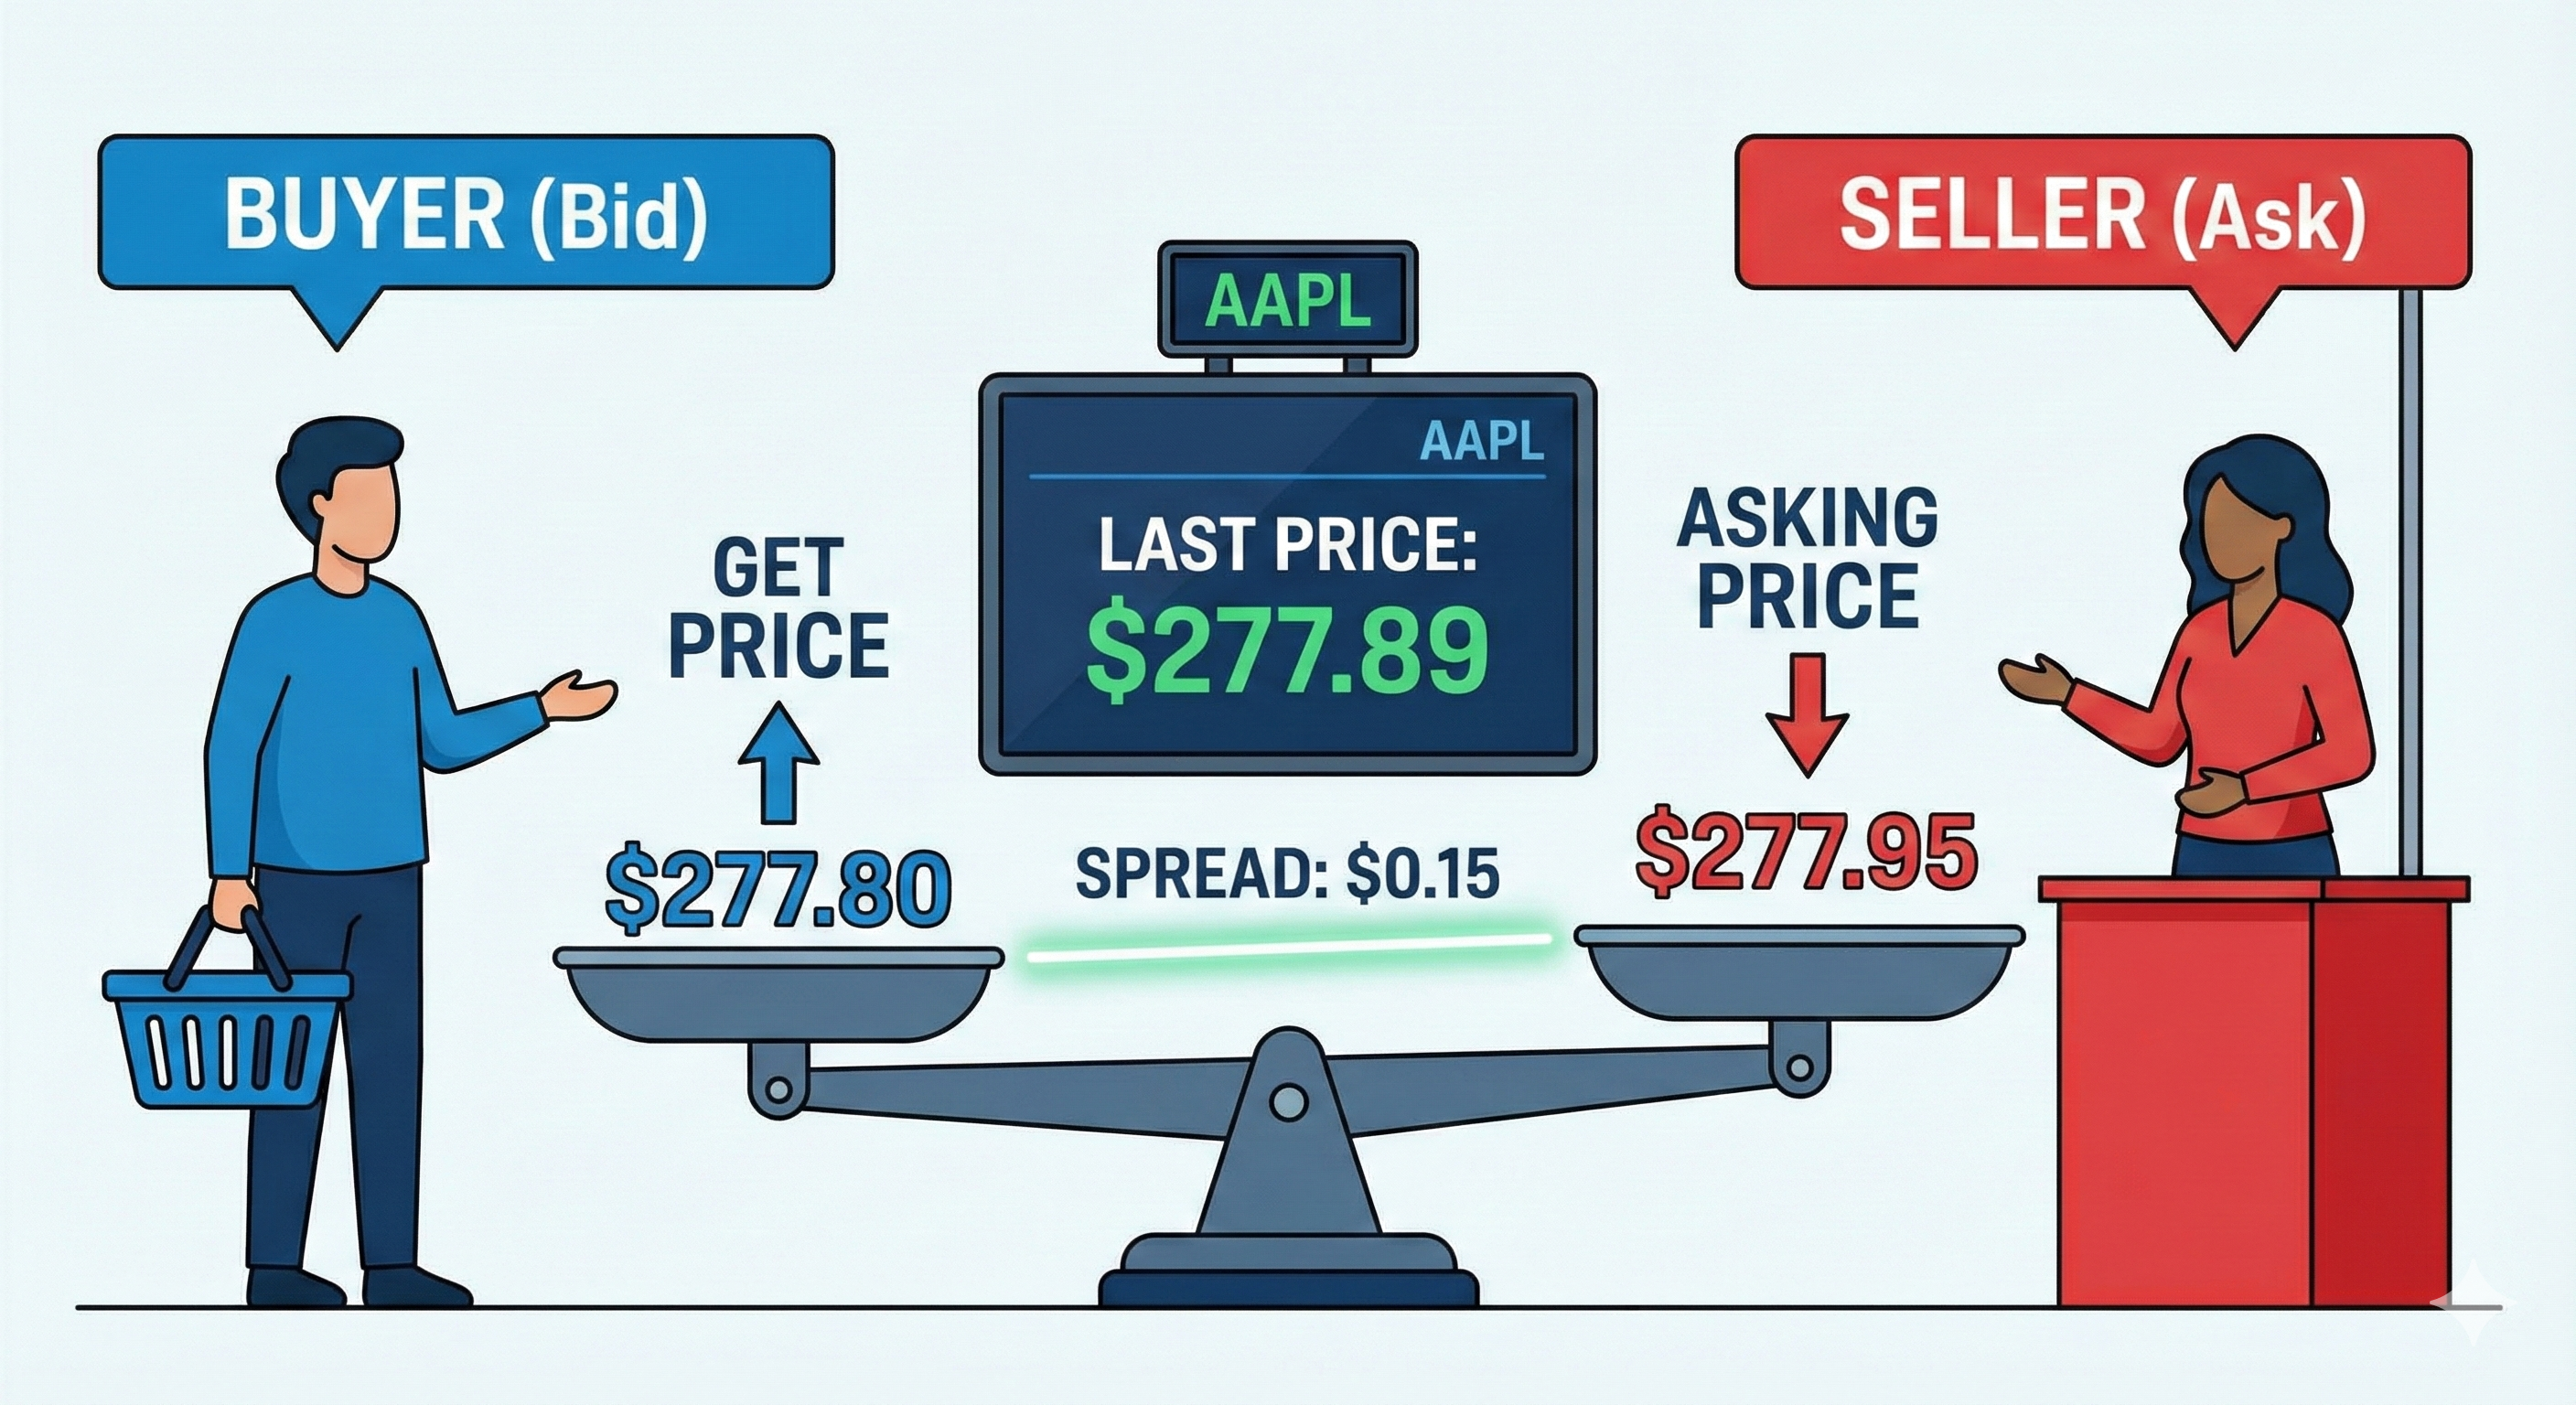
- Bid: The highest price a buyer is currently willing to pay for the stock.
- Ask: The lowest price a seller is currently willing to accept for the stock.
The Example:
- Last Price: 277.89
- Bid: 277.80
- Ask: 277.95
If you click "Buy" immediately (using a market order), you will likely pay the Ask price (277.95). If you are selling, you will receive the Bid price (277.80).
The difference between these two numbers is called the Spread. A small spread (like roughly 0.15 for a stock priced at 277) indicates a very healthy, active market.
Market Activity: Volume and Liquidity
Below the price data, you will find Volume. This number represents the total number of shares that have changed hands during the current trading session.
- Volume: The raw count of trades today (e.g., 45,000,000 shares).
- Average Volume: The normal amount of shares traded over a typical period (usually 30 days).
Real-World Application: If Apple normally trades 50 million shares a day, but today it has already traded 150 million, something big is happening. High volume often confirms a trend; if a stock price is dropping on high volume, it suggests strong selling pressure from institutions.
This concept is closely tied to liquidity. To understand why high volume makes it safer for you to trade, check out our guide on what is liquidity in stock market.
Historical Context: Highs, Lows, and Ranges
A single price tells you "how much," but it doesn't tell you "how high" or "how low" compared to history.
- Day’s Range: The lowest and highest prices the stock hit today. (e.g., 276.10 – 279.50). This shows the daily volatility.
- 52-Week Range: The lowest and highest prices over the last year. (e.g., 180.00 – 285.00).
Why it matters: If AAPL is trading at 277.89 and the 52-week high is around 285.00, the stock is trading near its peak. Some investors see this as momentum (strength), while others might fear it is "overbought." Conversely, looking at the long-term performance, seeing a 5 years return of 123.44% confirms that despite daily fluctuations, the long-term trend has been significantly upward. For more on spotting buying opportunities, read how to find undervalued stocks.
Valuation and Company Health
Now we move from "trading data" to "fundamental data." These numbers help you decide if the company is actually worth the price tag.
Market Capitalization (Market Cap)
This represents the total value of the company. It is calculated by multiplying the current stock price by the total number of outstanding shares.
- Formula: Share Price × Total Shares = Market Cap.
- Context: With a share price over 277, Apple remains a "Mega Cap" company worth trillions of dollars. Generally, larger companies are more stable, while smaller companies (Small Cap) are riskier but offer higher growth potential.
PE Ratio and EPS
These are the most popular metrics for valuing a stock.
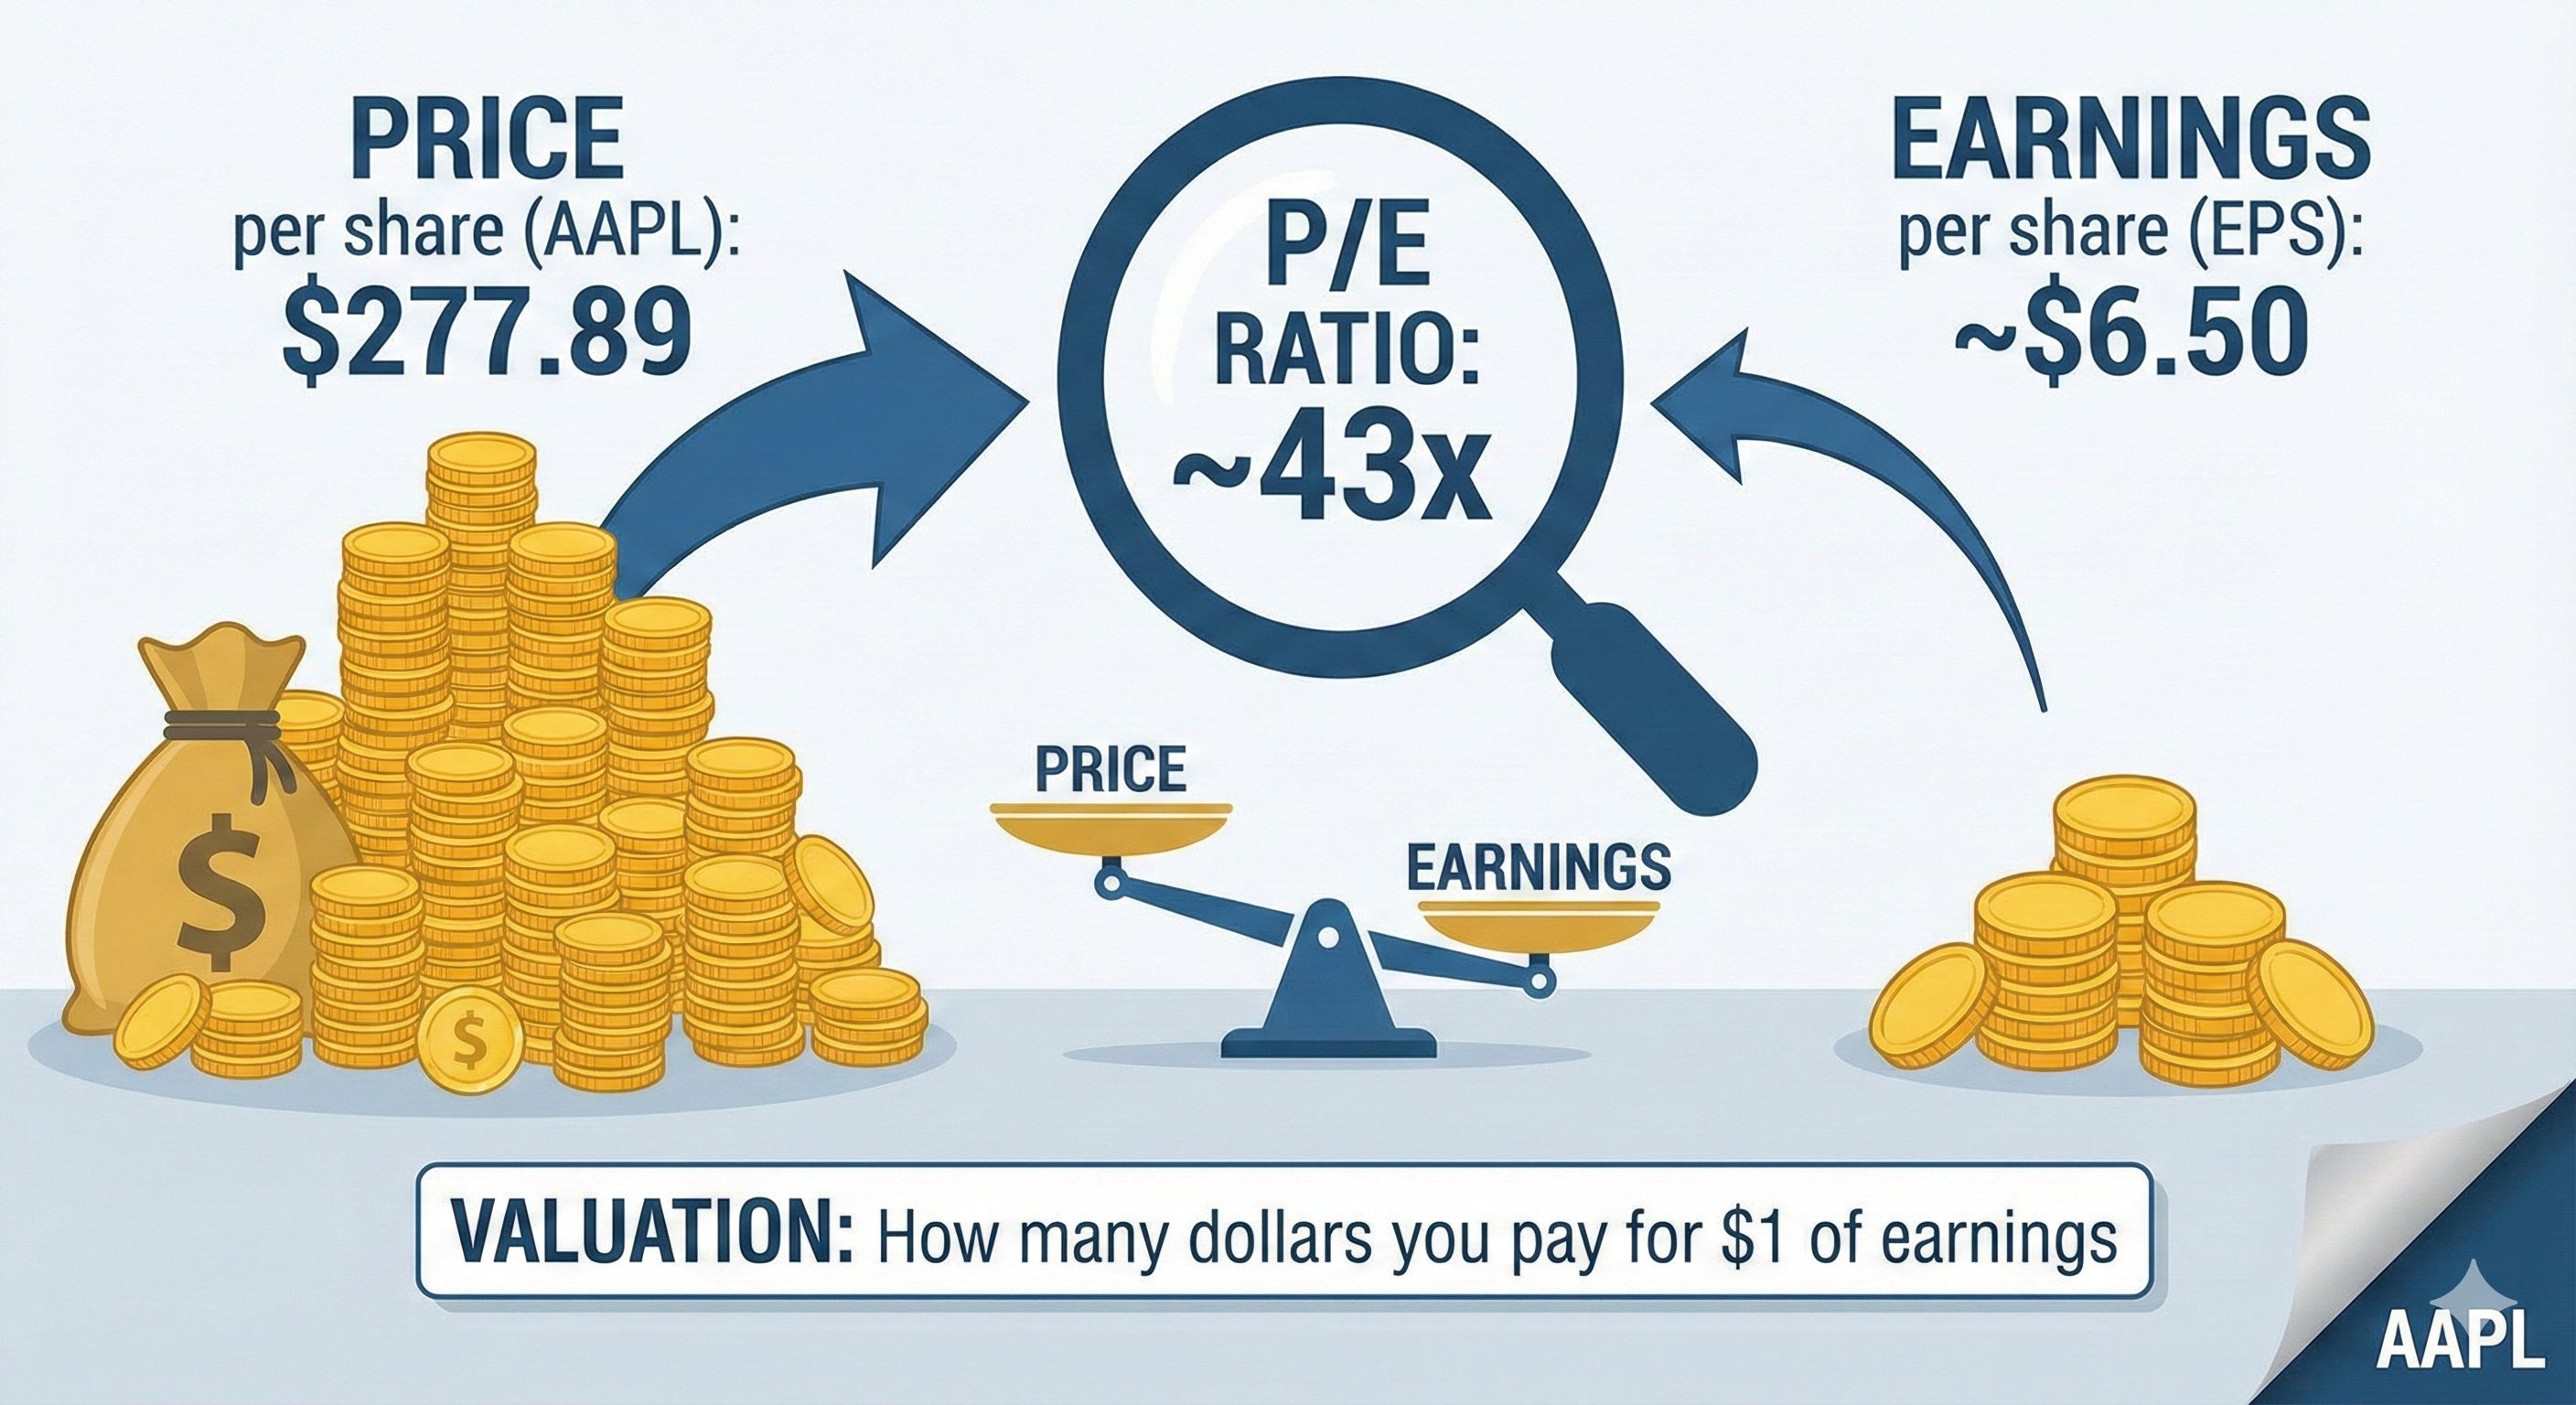
- EPS (Earnings Per Share): How much profit the company makes for every share of stock it has issued.
- PE Ratio (Price-to-Earnings): A measure of how expensive the stock is. It compares the current price to the earnings. A P/E of 30 means you are paying 30 dollars for every 1 dollar of profit the company makes.
Is a high P/E ratio bad? Not necessarily. It might mean investors expect high growth in the future. To understand the nuance between these two metrics, see our comparison of Eps vs pe ratio.
Income Potential: Dividends
Not all profits are kept by the company; some are paid out to you.
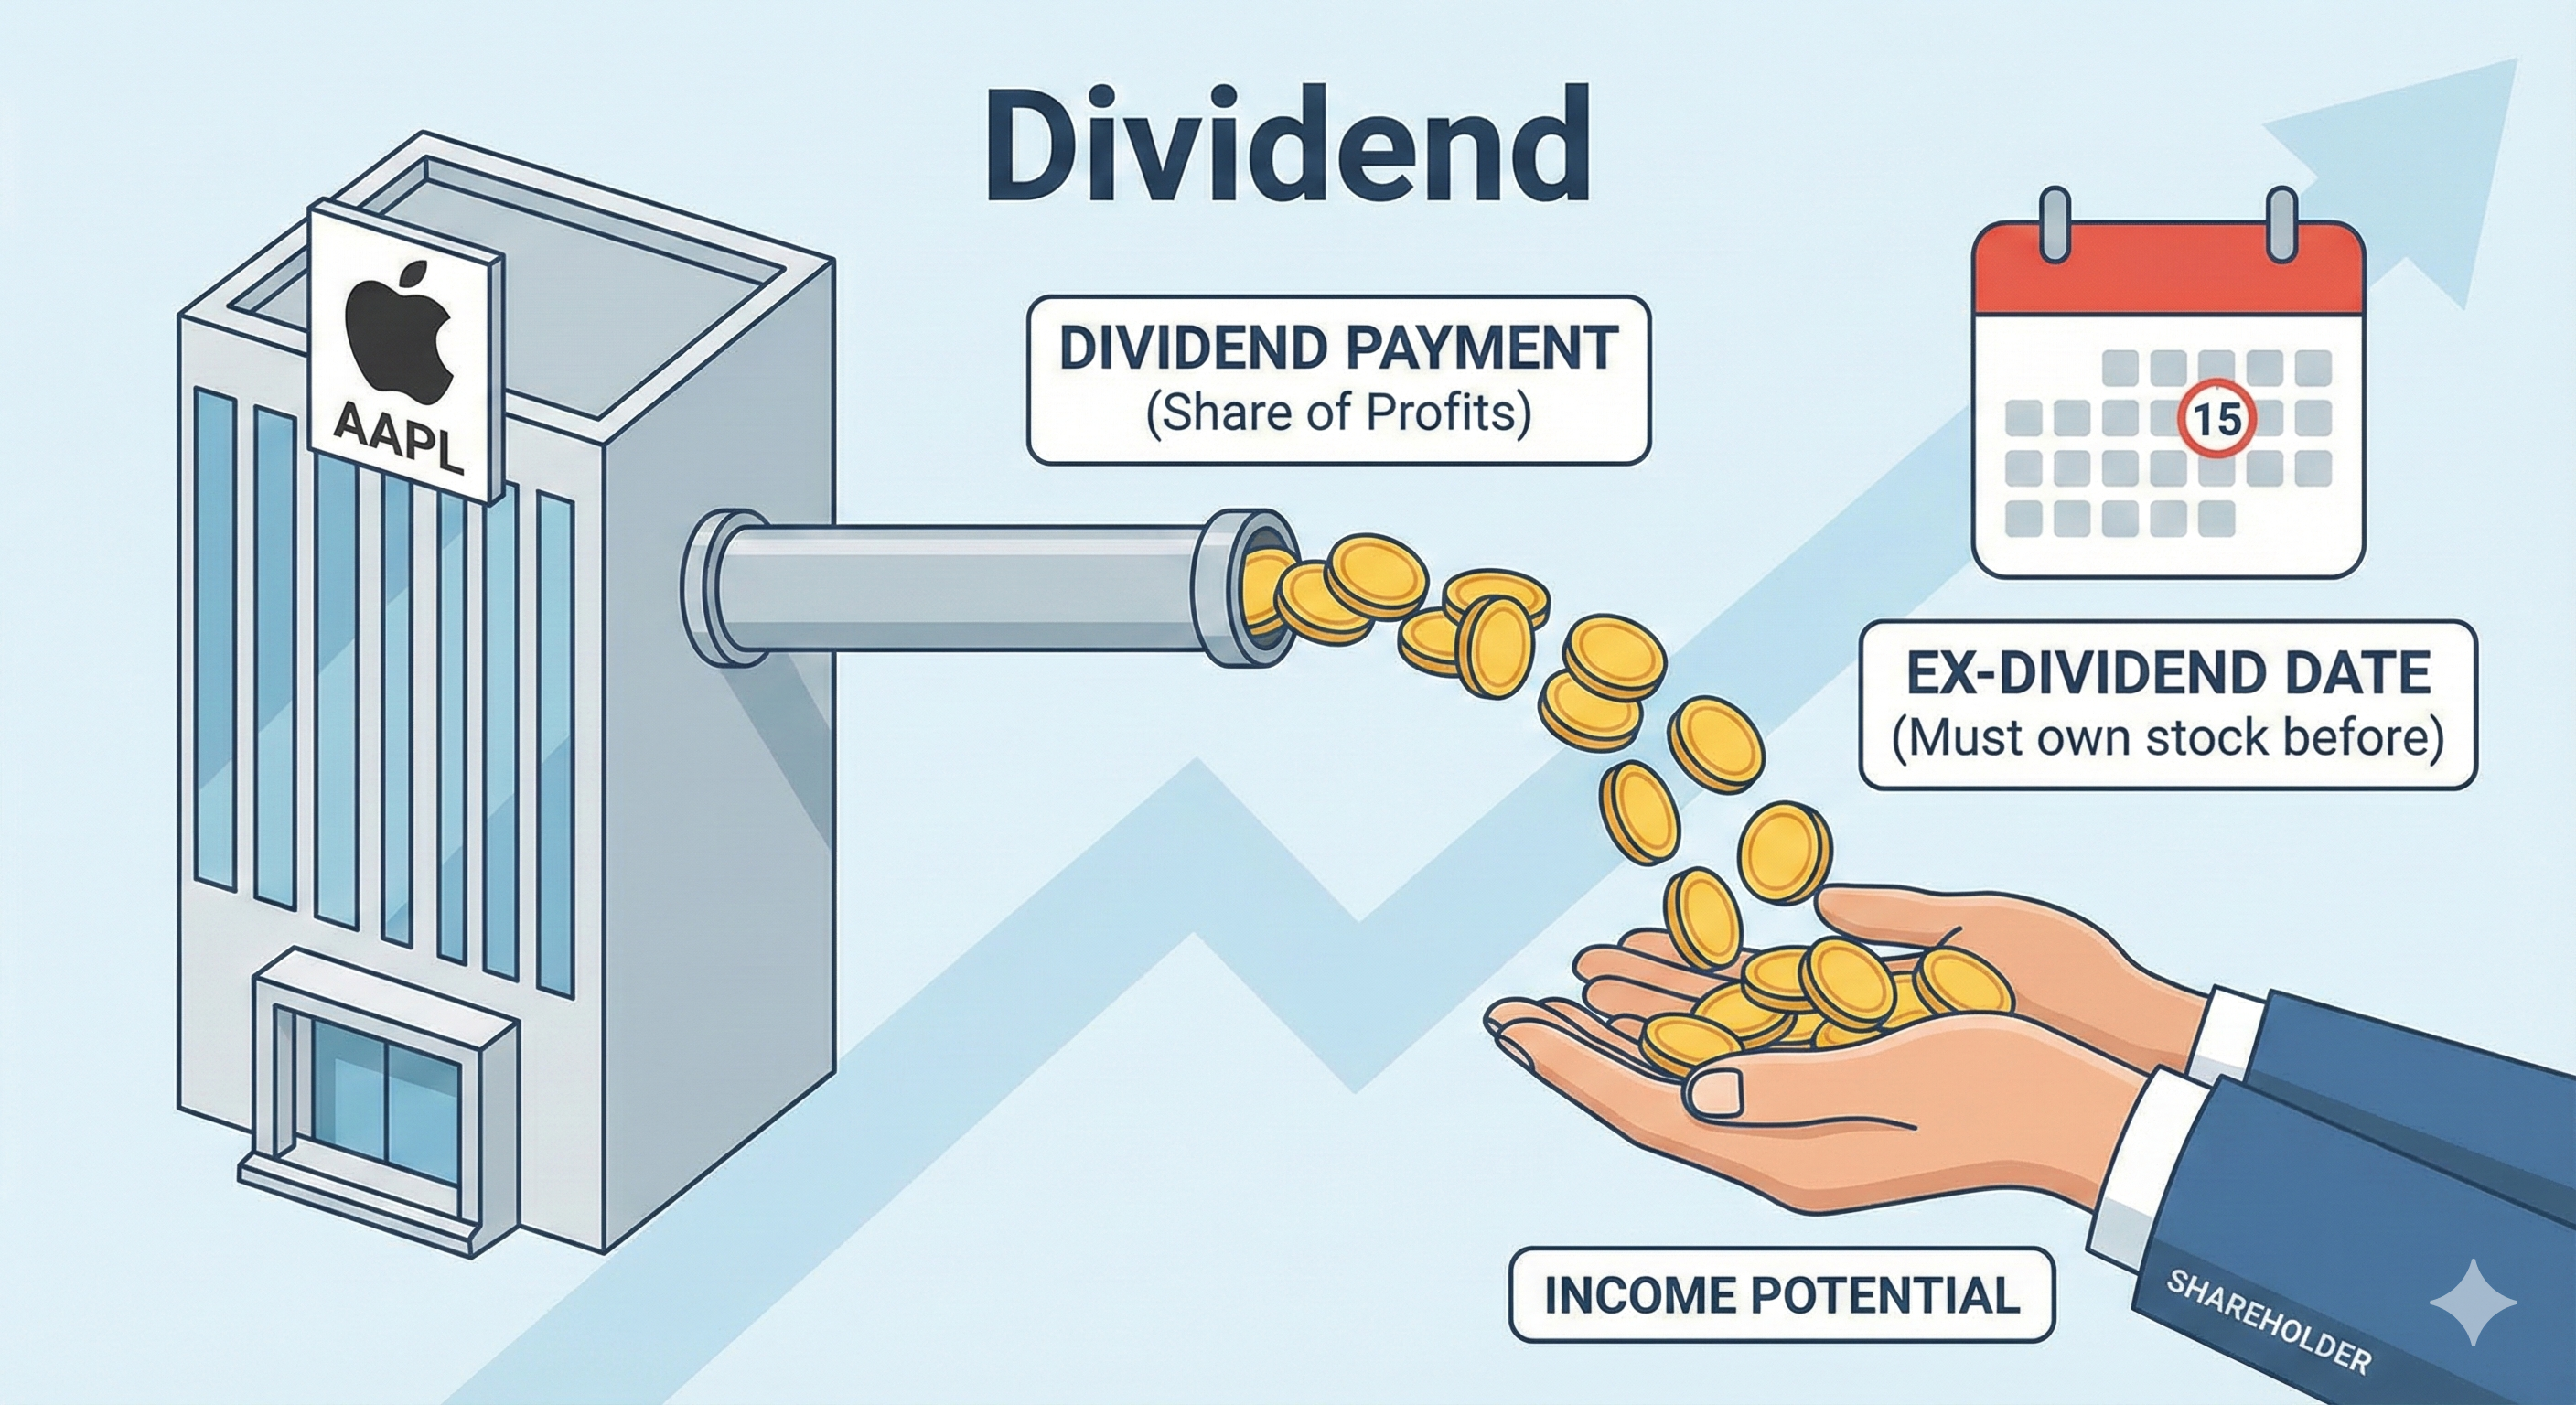
- Dividend Yield: This percentage tells you how much cash you will get back annually just for holding the stock, relative to the share price.
- Ex-Dividend Date: You must own the stock before this date to receive the next scheduled payment.
For example, if a company has a yield of 0.5%, it pays a small portion of its profit to shareholders. Older, more established companies like utility providers often have higher yields. You can learn more about how this works in what is a dividend rate.
Frequently Asked Questions
What Is a Stock Quote?
A stock quote is a set of data that details the price and activity of a specific stock at a specific moment in time. It includes information such as the last traded price, the bid and ask prices, volume, and the daily high and low.
What Is a Ticker Symbol?
A ticker symbol is a unique series of letters (usually 1 to 5 characters) assigned to a security for trading purposes. For example, the ticker symbol for Apple is AAPL, and for Microsoft, it is MSFT. It acts as an abbreviation to identify the company on the stock exchange.
What Is the Bid Price?
The bid price is the highest price a buyer is currently willing to pay for a share of stock. If you are looking to sell your shares immediately using a market order, this is the price you will likely receive.
What Is the Ask Price?
The ask price is the lowest price a seller is currently willing to accept for a share of stock. If you are looking to buy shares immediately using a market order, this is the price you will likely pay.
Conclusion
Reading a stock quote is the first step in financial literacy. It allows you to separate the noise from the data. When you look at a quote for a company like Apple, do not just stare at the big number. Look at the color of the change to gauge immediate sentiment, check the spread to see the liquidity, and glance at the 5-year return to understand the bigger picture.
Once you master reading the quote, your next step is deciding how to choose which quotes to look at. You can start by exploring different analysis strategies, such as the top down vs bottom up approach.
Sources
- U.S. Securities and Exchange Commission (SEC). "Stock Quote." Investor.gov.
- U.S. Securities and Exchange Commission (SEC). "Bid/Ask Spread." Investor.gov.
- U.S. Securities and Exchange Commission (SEC). "Market Capitalization." Investor.gov.
- U.S. Securities and Exchange Commission (SEC). "Price-to-Earnings Ratio (P/E Ratio)." Investor.gov.
- U.S. Securities and Exchange Commission (SEC). "Dividend." Investor.gov.